The Galaxy Zoo kaggle competition is something that I feel a special connection with. Not only because my own background is in astrophysics, but this competition first introduced me to Kaggle and data science. While I didn’t have the time or knowledge to compete at the time, I followed it and I knew even then that the winning solutions would be based on convolutional neural networks.
I’ve been learning deep learning on and off since 2017, but it wasn’t until fastai that I actually managed to get from zero to one. After finishing the first course in fastai, going back and doing the Galaxy Zoo challenge was actually pretty undaunting! It’s basically a quirky image multi-label classification classification posed as a regression problem. Once I got my head around this, I was very fast in getting a CNN running in fastai.
Problem
From the Galaxy Zoo challenge description:
Understanding how and why we are here is one of the fundamental questions for the human race. Part of the answer to this question lies in the origins of galaxies, such as our own Milky Way. Yet questions remain about how the Milky Way (or any of the other ~100 billion galaxies in our Universe) was formed and has evolved. Galaxies come in all shapes, sizes and colors: from beautiful spirals to huge ellipticals. Understanding the distribution, location and types of galaxies as a function of shape, size, and color are critical pieces for solving this puzzle.
…

(Image Credit: ESA/Hubble & NASA)
Galaxies in this set have already been classified once through the help of hundreds of thousands of volunteers, who collectively classified the shapes of these images by eye in a successful citizen science crowdsourcing project. However, this approach becomes less feasible as data sets grow to contain of hundreds of millions (or even billions) of galaxies. That’s where you come in.
This competition asks you to analyze the JPG images of galaxies to find automated metrics that reproduce the probability distributions derived from human classifications. For each galaxy, determine the probability that it belongs in a particular class. Can you write an algorithm that behaves as well as the crowd does?
Rather than being an image classification or image multi-label classification problem, that one might initially assume, this problem is actually a regression problem. The task is actually to predict the distribution of how the users would label an image of a galaxy. The UX presented to the user is that of a descision tree of questions:

The distribution of user’s answers to these questions is represented as a 37D vector of floats with values between 0 and 1. These values are weighted according to the description here.
The task is therefore to train an algorithm that takes an image of a galaxy as an input and outputs a 37D vector of floats; it is a multi-dimensional regression problem.
Preprocessing
Let’s look at a batch of the images:
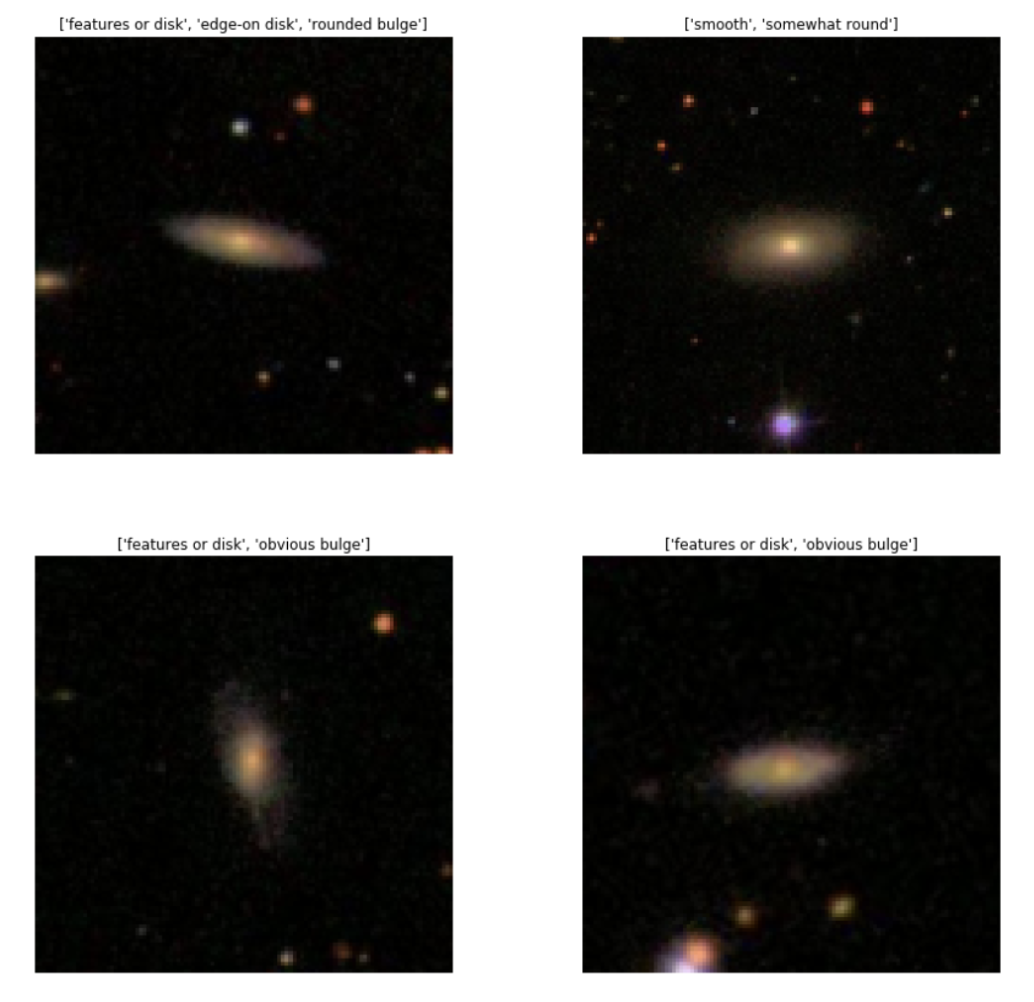
The target galaxy is always in the centre of the image. There is a lot of redundant space round the outside of the galaxies. Each image is 424x424. I cropped the images down to 224x224. This saved on computation without throwing out resolution.
Transforms
The transforms I used:
tfms = get_transforms(flip_vert=False, max_warp=0.0, max_rotate=360, max_lighting=0.0, max_zoom=1.05)
Here they are as a grid:
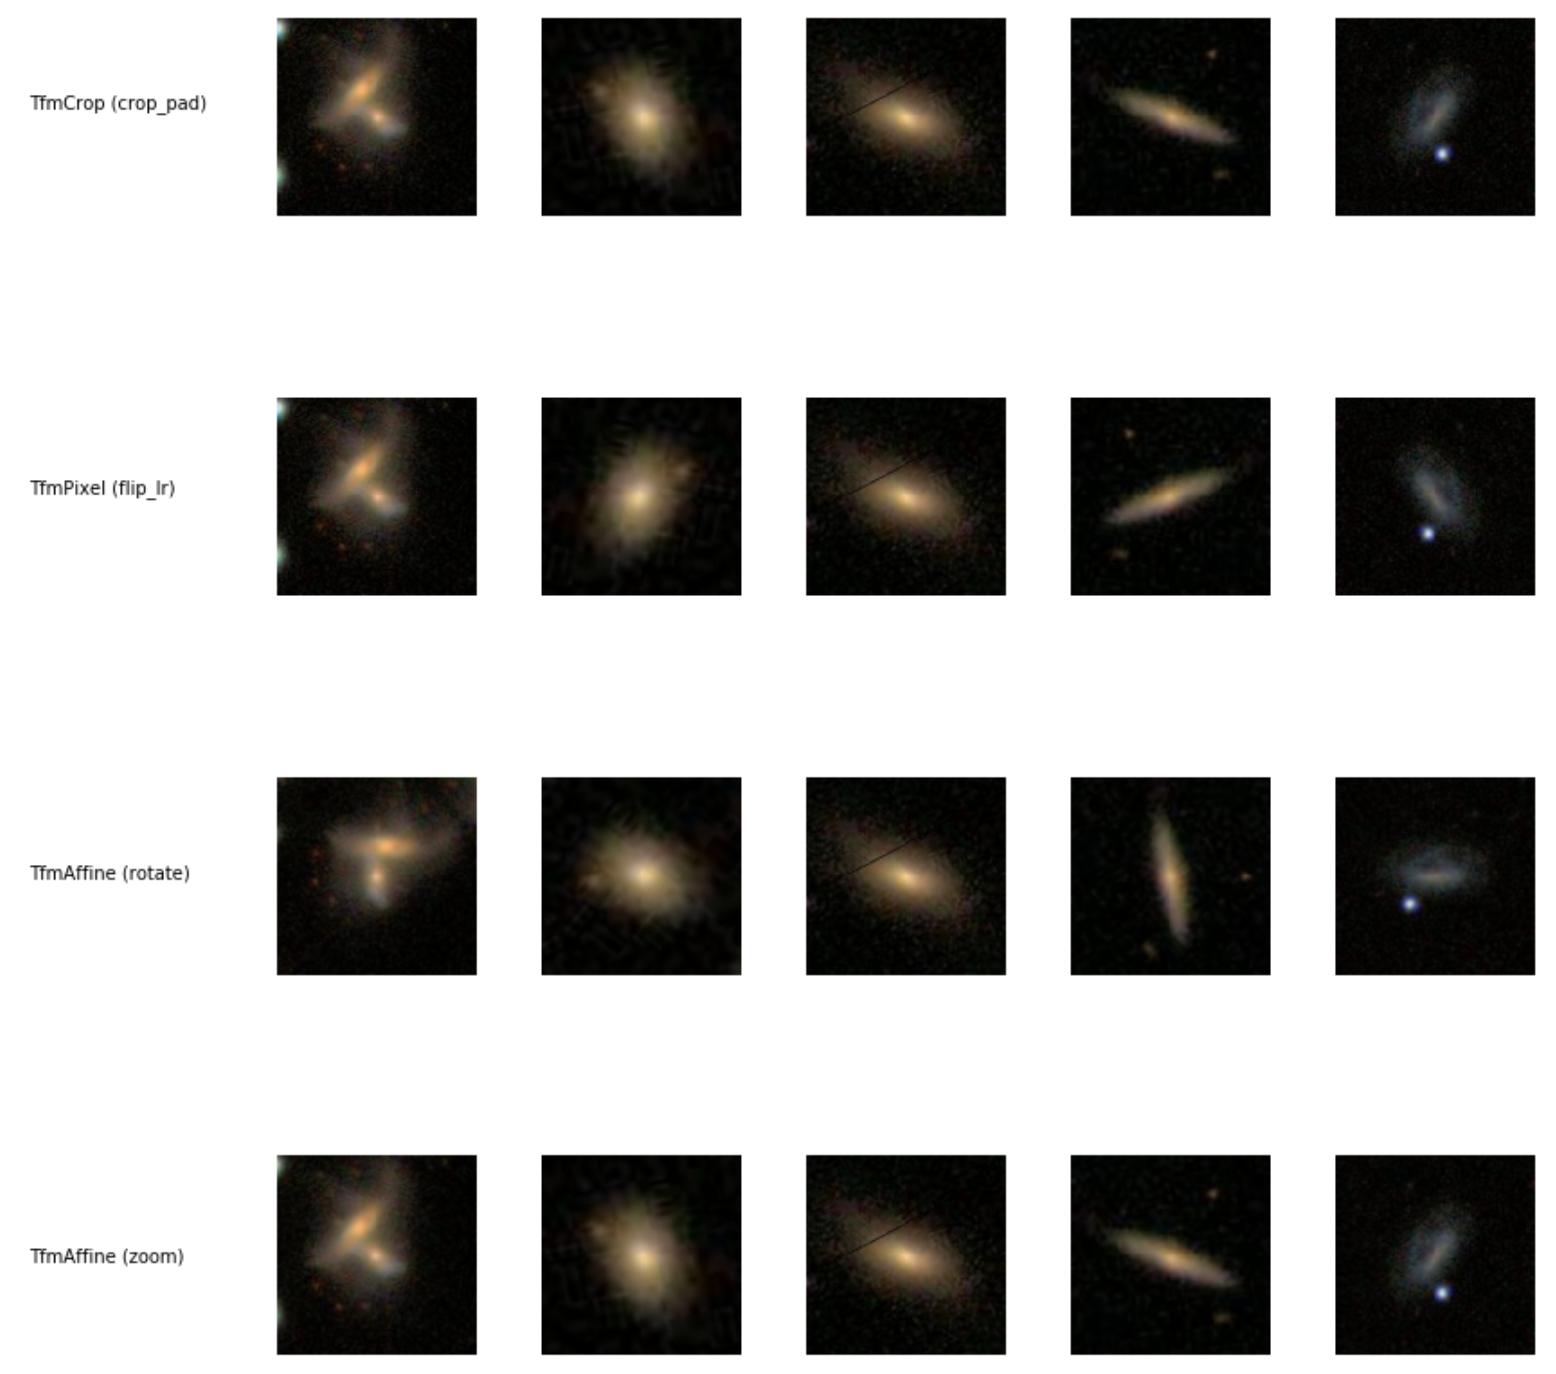
I also tried with adjusting the brightness and contrast, but I found that that didn’t improve anything.
DataBlock
The image file names and accompanying classification vectors are stored in a CSV file training_solutions_rev1.
I modified the fastai class FloatList to GalaxyFloatList, which is the same except it uses GalaxyFloatItem instead of FloatItem. GalaxyFloat has the show method subclassed so that the 37D float vector is converted to a string using a function I wrote called vec2labels.
class GalaxyFloatItem(FloatItem):
    def show(self, ax:plt.Axes, **kwargs):
        "Translate the GalaxyZoo vector into a list of features"
        ax.set_title(vec2labels(self.data))


class GalaxyFloatList(ItemList):
    def __init__(self, items:Iterator, log:bool=False, classes:Collection=None, **kwargs):
        super().__init__(np.array(items, dtype=np.float32), **kwargs)
        self.log = log
        self.copy_new.append('log')
        self.c = self.items.shape[1] if len(self.items.shape) > 1 else 1
        self.loss_func = MSELossFlat()

    def get(self, i):
        o = super().get(i)
        return GalaxyFloatItem(np.log(o) if self.log else o)

    def reconstruct(self,t): return GalaxyFloatItem(t.numpy())


src = (ImageList.from_csv(path,
                          'training_solutions_rev1.csv',
                          folder='images_training_rev1_cropped',
                          suffix='.jpg',
                          cols=0)
           		 .split_by_rand_pct(0.2)
            	 .label_from_df(cols=list(range(1, 38)), label_cls=GalaxyFloatList))
data = (src.transform(tfms, size=112, resize_method=ResizeMethod.SQUISH,
                      padding_mode='reflection').databunch()).normalize(imagenet_stats)
Model
For my model I used a ResNet50 CNN pretrained on Imagenet.
learner = cnn_learner(data, models.resnet50, metrics=rmse, ps=0.1, wd=1e-4,)
learner.model[-1] = nn.Sequential(*learner.model[-1], GalaxyOutput())
At the end of the network I tacked on a simple layer that correctly normalises the probability vector outputed by the network so that the output obeys the rules of probability. I got this idea after looking at the winning submission. Training without normalising the output also worked quite well, I found, however it does produce ill-formed results such as small negative numbers so normalising is good idea to get a small performance boost.
class GalaxyOutput(nn.Module):
    def __init__(self):
        super().__init__()

    def forward(self, x):
        return answer_probability(x)
Here is the code that normalises the probability vectors:
task_sectors = {
    1: slice(0, 3),
    2: slice(3, 5),
    3: slice(5, 7),
    4: slice(7, 9),
    5: slice(9, 13),
    6: slice(13, 15),
    7: slice(15, 18),
    8: slice(18, 25),
    9: slice(25, 28),
    10: slice(28, 31),
    11: slice(31, 37),
}

def normalize(q):
    return q / (q.sum(dim=1) + eps)[:, None]


def answer_probability(x):
  	# Source: http://benanne.github.io/2014/04/05/galaxy-zoo.html
    # clip probabilities
    nb = x.shape[0]
    x = x.clamp_min(0.)

    # normalize
    q1 = normalize(x[:, task_sectors[1]])
    q2 = normalize(x[:, task_sectors[2]])
    q3 = normalize(x[:, task_sectors[3]])
    q4 = normalize(x[:, task_sectors[4]])
    q5 = normalize(x[:, task_sectors[5]])
    q6 = normalize(x[:, task_sectors[6]])
    q7 = normalize(x[:, task_sectors[7]])
    q8 = normalize(x[:, task_sectors[8]])
    q9 = normalize(x[:, task_sectors[9]])
    q10 = normalize(x[:, task_sectors[10]])
    q11 = normalize(x[:, task_sectors[11]])

    # reweight
    w1 = 1.0
    w2 = q1[:, 1] * w1
    w3 = q2[:, 1] * w2
    w4 = w3
    w5 = w4
    w6 = 1.0
    w7 = q1[:, 0] * w1
    w8 = q6[:, 0] * w6
    w9 = q2[:, 0] * w2
    w10 = q4[:, 0] * w4
    w11 = w10

    wq1 = w1*q1
    wq2 = w2[:, np.newaxis]*q2
    wq3 = w3[:, np.newaxis]*q3
    wq4 = w4[:, np.newaxis]*q4
    wq5 = w5[:, np.newaxis]*q5
    wq6 = w6*q6
    wq7 = w7[:, np.newaxis]*q7
    wq8 = w8[:, np.newaxis]*q8
    wq9 = w9[:, np.newaxis]*q9
    wq10 = w10[:, np.newaxis]*q10
    wq11 = w11[:, np.newaxis]*q11

    return torch.cat([wq1, wq2, wq3, wq4, wq5, wq6, wq7, wq8, wq9, wq10, wq11], dim=1)
This code is pretty yuck so I will explain. task_sectors are the slices of the probability vector corresponding to the answers of each of the questions (tasks) in the decision tree. These sectors are all normalised individually, so they are >=0 and sum to 1.
Training
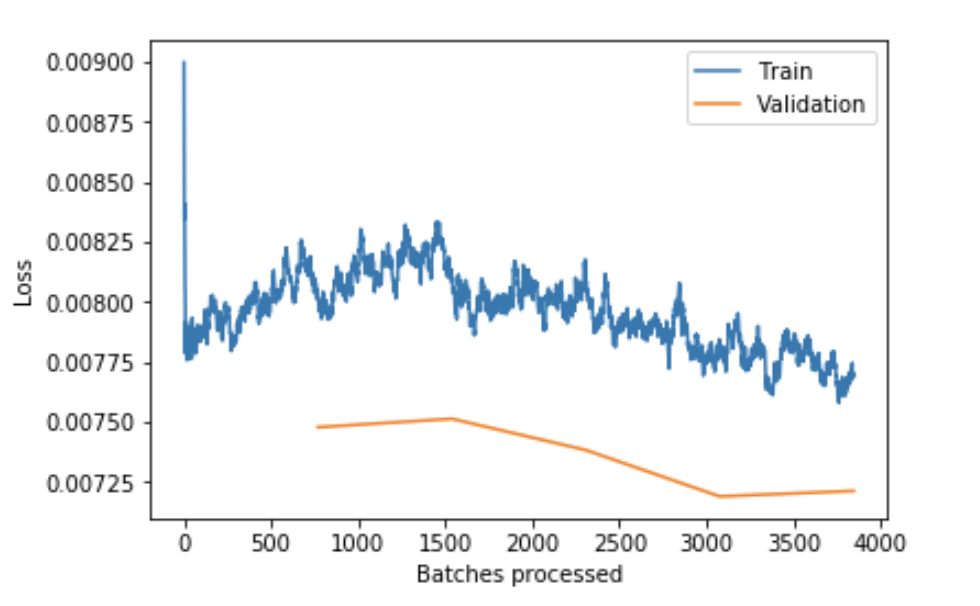
One of the things I stuggled a lot in remedying in this problem was underfitting. With the default settings of CNNs in fastai (ps=0.5 and wd=1e-2) the validation loss was consistently lower than the training loss even after training for many epochs. The loss was also not improving over subsequent cycles. Here is an example of the loss plot for this case:
According to Jeremy in lesson 2 of fastai, underfitting can be remedied with reducing regularization. After many experiments I settled on the following values:
ps=0.1wd=1e-4
I then trained the network using the freeze/unfreeze protocol taught in the fastai course and used progressive resizing to get the drive down the error further. To overcome underfitting I had to run many cycles until the validation error stopped being less than the training error.
Training Programme
-
Train head 2 epochs
lr=5e-2 -
Unfreeze all layers
-
Train 10 epochs
lr=1e-4. Validation error here is ~0.081.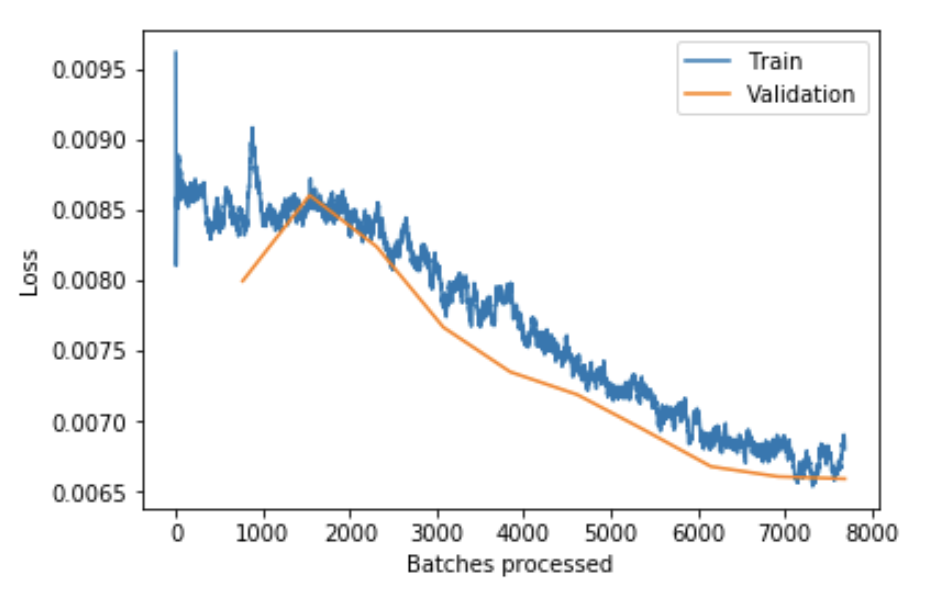
-
Resize to 224x224
-
data = (src.transform(tfms, padding_mode='reflection') .databunch().normalize(imagenet_stats)) learner.data = data data.train_ds[0][0].shape -
Freeze all layers
-
Train head 2 epochs
lr=1e-2 -
Unfreeze
-
learner.fit_one_cycle(6, 1e-4)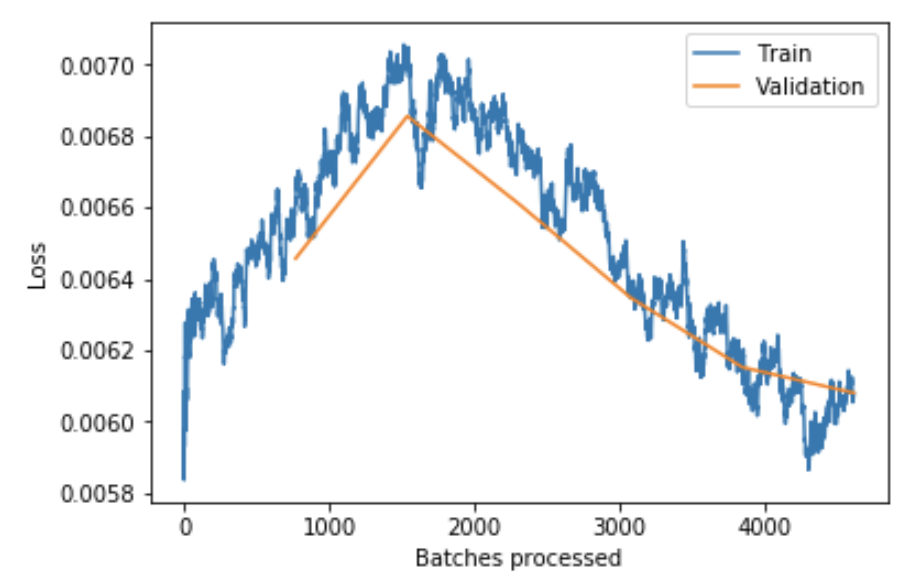
-
learner.fit_one_cycle(6, 1e-4)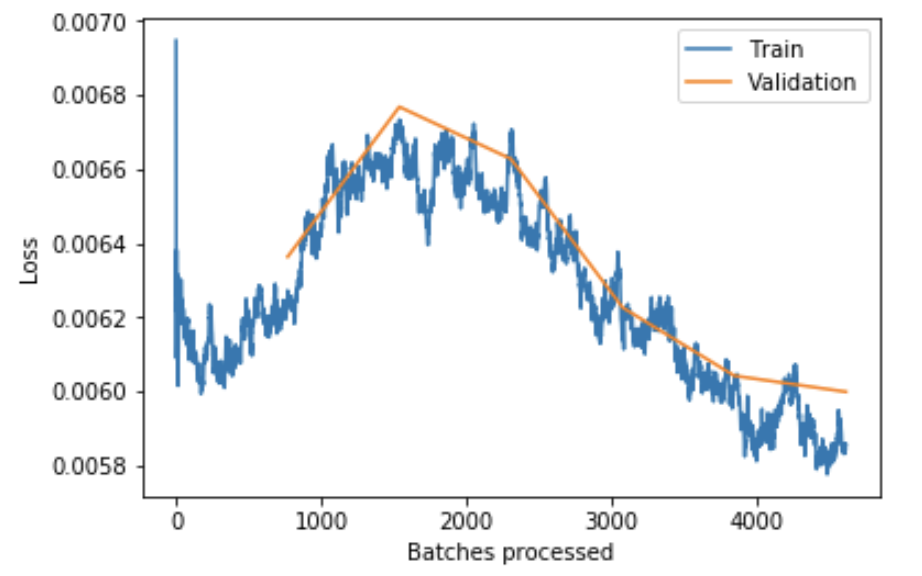
-
learner.fit_one_cycle(6, 1e-4)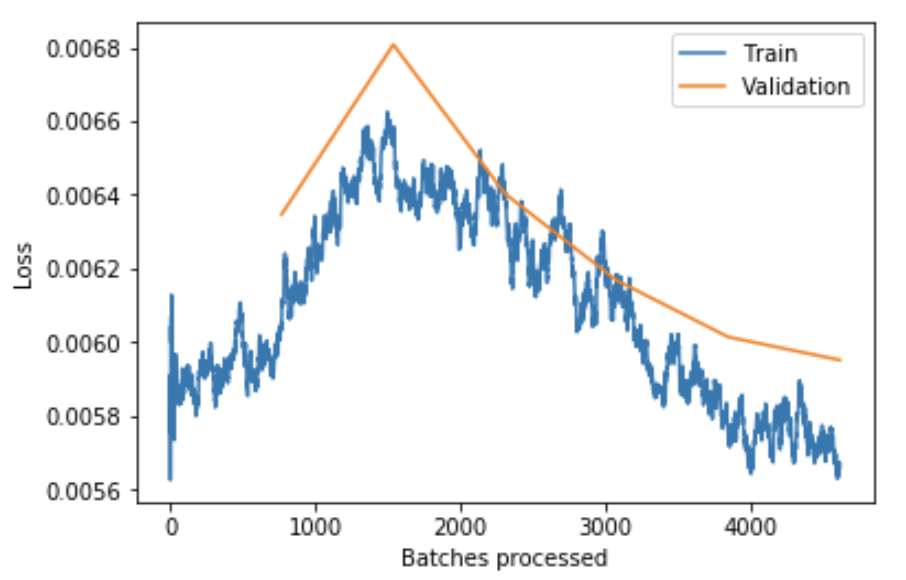
-
learner.fit_one_cycle(8, 1e-4/5)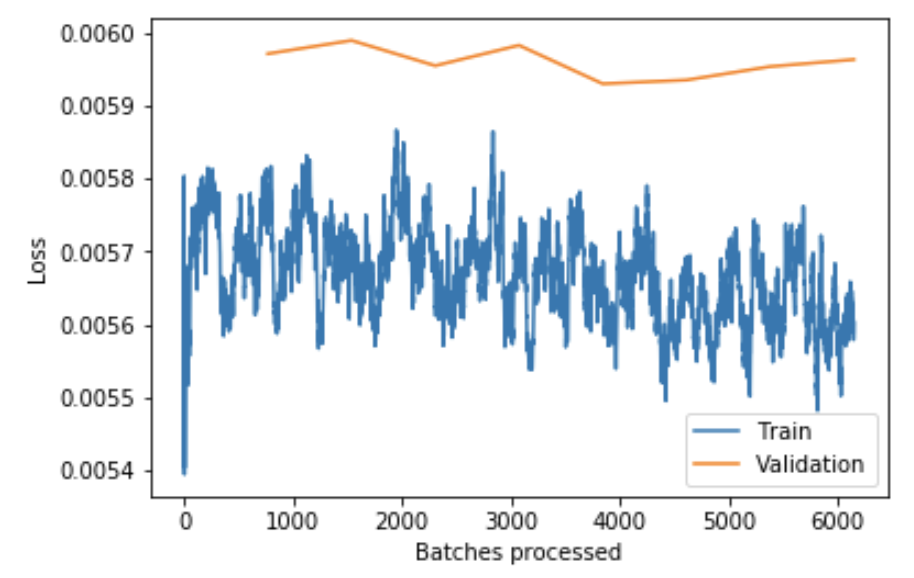
-
Change dropout:
ps=0.25 -
learner.fit_one_cycle(6, slice(1e-6, 1e-5/2))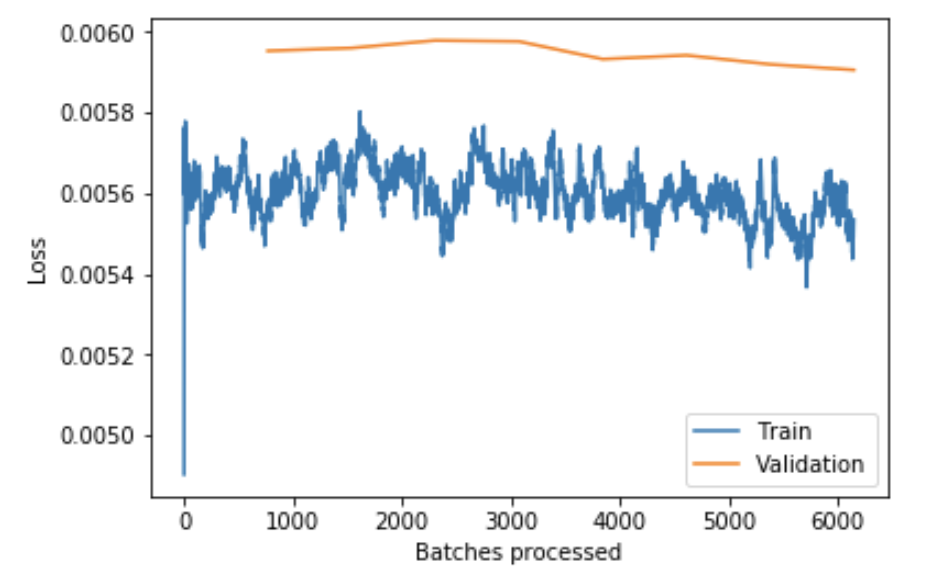
-
The final training epochs:
epoch train_loss valid_loss root_mean_squared_error time 0 0.005536 0.005953 0.077037 05:08 1 0.005683 0.005960 0.077083 05:09 2 0.005581 0.005979 0.077199 05:11 3 0.005662 0.005976 0.077189 05:09 4 0.005648 0.005932 0.076905 05:10 5 0.005611 0.005942 0.076965 05:11 6 0.005511 0.005919 0.076818 05:09 7 0.005534 0.005906 0.076728 05:10
Total training time: ~200 minutes
Final Validation RMSE: 0.076728
Summary and Further Thoughts
This competition was required a lot more work that I thought it would be, even with all the convenience of fastai. Before I started I expect this project to be a multi-label classification problem, but it’s actually a regression problem. Writing the normalization layer was tricky to figure out and in the end I learned a lot about PyTorch and fastai by writing this and appending it onto a pretrained network.
I believe my main issue was underfitting in this problem. I remedied this by reducing the regularisation and running for more epochs. In the future I will do further experiments to see if it can be fixed in another way with a larger network or different learning rate schedules.
The final validation RMSE is about the equal to what Dielemann achieved for a single model: http://benanne.github.io/2014/04/05/galaxy-zoo.html. I’m a bit disappointed that I couldn’t do better than the result from 5 years ago, but on the other hand the amount of code required to do this today compared to what Dielemann wrote is tiny. His final score was down at 0.074 after bagging the results of many CNNs. This is a huge amount of effort and was necessary to win the Kaggle competition at the time, however I feel this isn’t worth trying to reproduce this.
My Jupyter notebooks for this are on github: https://github.com/jimypbr/galaxyzoo-fastai